Recent Posts

Strangely Simple at Voxbone
This week I started my new role as Head of Development at Voxbone whose tag line is “Strangely Simple Cloud Communications”.
It’s a small company of 200 people, head-quartered in Brussels, who (in my opinion) are having an out-sized impact on the telecomms industry by bringing an API based approach to what has previously been a very manual, regulated, and incumbent-driven area.
In my role I get to work with a great team of developers located across Europe including in Ireland, Belgium, Romania, and Moldova, alongside our product, infrastructure, and other groups.
read more
Some Lessons Learned in my time at Pivotal
I’m moving on from my current job so I wanted to capture some of the most important lessons I’ve learned during my time there. After nearly 7 years, there were a lot of lessons, so I challenged myself to narrow it down to a top 5-ish:
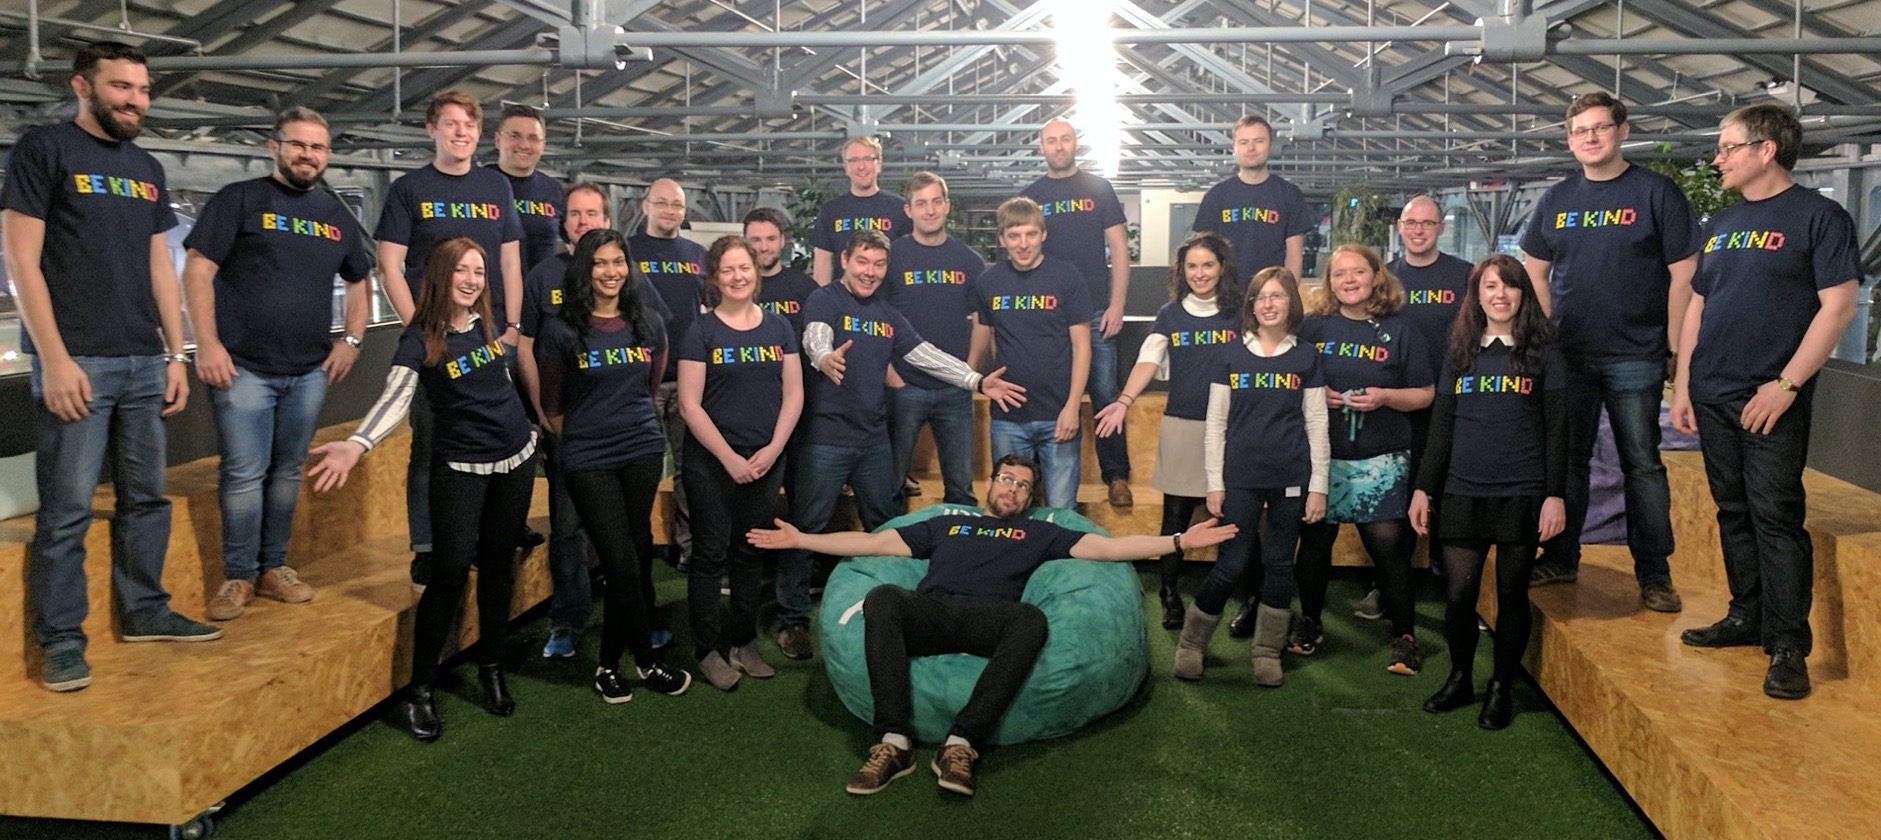
Always Be Kind This is the top priority for me in any personal interaction or decision making. A key point is learning to distinguish between ‘nice’ actions and ‘kind’ ones.
read more
Moving on from Pivotal
So, after nearly 7 years, my time with Pivotal has come to an end. It’s been a great journey, and I’ve had the opportunity to work with some great people in all different parts of the business across the world.
Thank you to everyone in and around Pivotal that made it so special!
Pivotal has now become part of VMware Tanzu, and I wish everyone continuing the best of luck & success in the future, and I hope you can continue demonstrating the excellence, honesty, and above all kindness that was a key part of Pivotal.
read more

Moving This Blog to Hugo and Netlify
For a long time, this blog has been running as a Wordpress app on Webfaction. When I first started using Wordpress, it was long before Wordpress.com provided simple managed services, so using your own LAMP stack hosted server was the preferred approach. A few hosting providers and PHP versions later, it’s probably time to move on.
This set up has served me well, but I’ve never really made use of the more dynamic elements of Wordpress.
read more
Advent of Code 2017 in Kotlin
I talk about Python a lot here but at work we also write quite a bit of Java (with Spring of course). Since it hit 1.0 in 2016, I’ve been hearing more and more about Kotlin as a viable alternative to standard Java on the JVM.
At Pivotal we’re seeing clients start to use Kotlin because of its brevity compared to Java, the ease of use of existing Java based libraries, the adoption by Google for Android, and the (relatively new) ability to also target Javascript.
read more
Flexible conda package dependencies on Cloud Foundry
The official Python Cloud Foundry buildpack has support for conda environments using the environment.yml file. This provides a lot of flexibility for Python (and other) dependencies and helps you to use packages from other public and private sources including your own locally built ones.
Using other conda channels
One thing this allows you to do is reference other channels such as conda-forge, and get packages from there instead of the standard Anaconda provided default channel.
read more
Bringing a Python Django app to Cloud Foundry in 2017
In this post I want to answer the question: What do you have to do to run a Django web app on Cloud Foundry in 2017?
In the past, a few other people have described their approaches, but given that Cloud Foundry is continuously changing and improving, I thought it would be good to revisit the topic and learn about Python & Django support in 2017.
Python on Cloud Foundry Cloud Foundry is a polyglot application deployment system.
read more
Mapping Dublin parish boundaries
TLDR: Go straight to the Dublin Parish Boundaries map (new URL April 2020).
In Ireland, most primary schools are run by the Catholic Church and the rules for enrolling often include complex lists of rules with those in the local parish often being preferred. This means when you are looking for accommodation to rent or buy it can be very important to know in advance which parish the property is located in.
read more